
Your Dashboard Says Profit, Your Bank Says Broke: Auditing the Gap Before It Kills Your Brand

Here are two ways to close out a month.
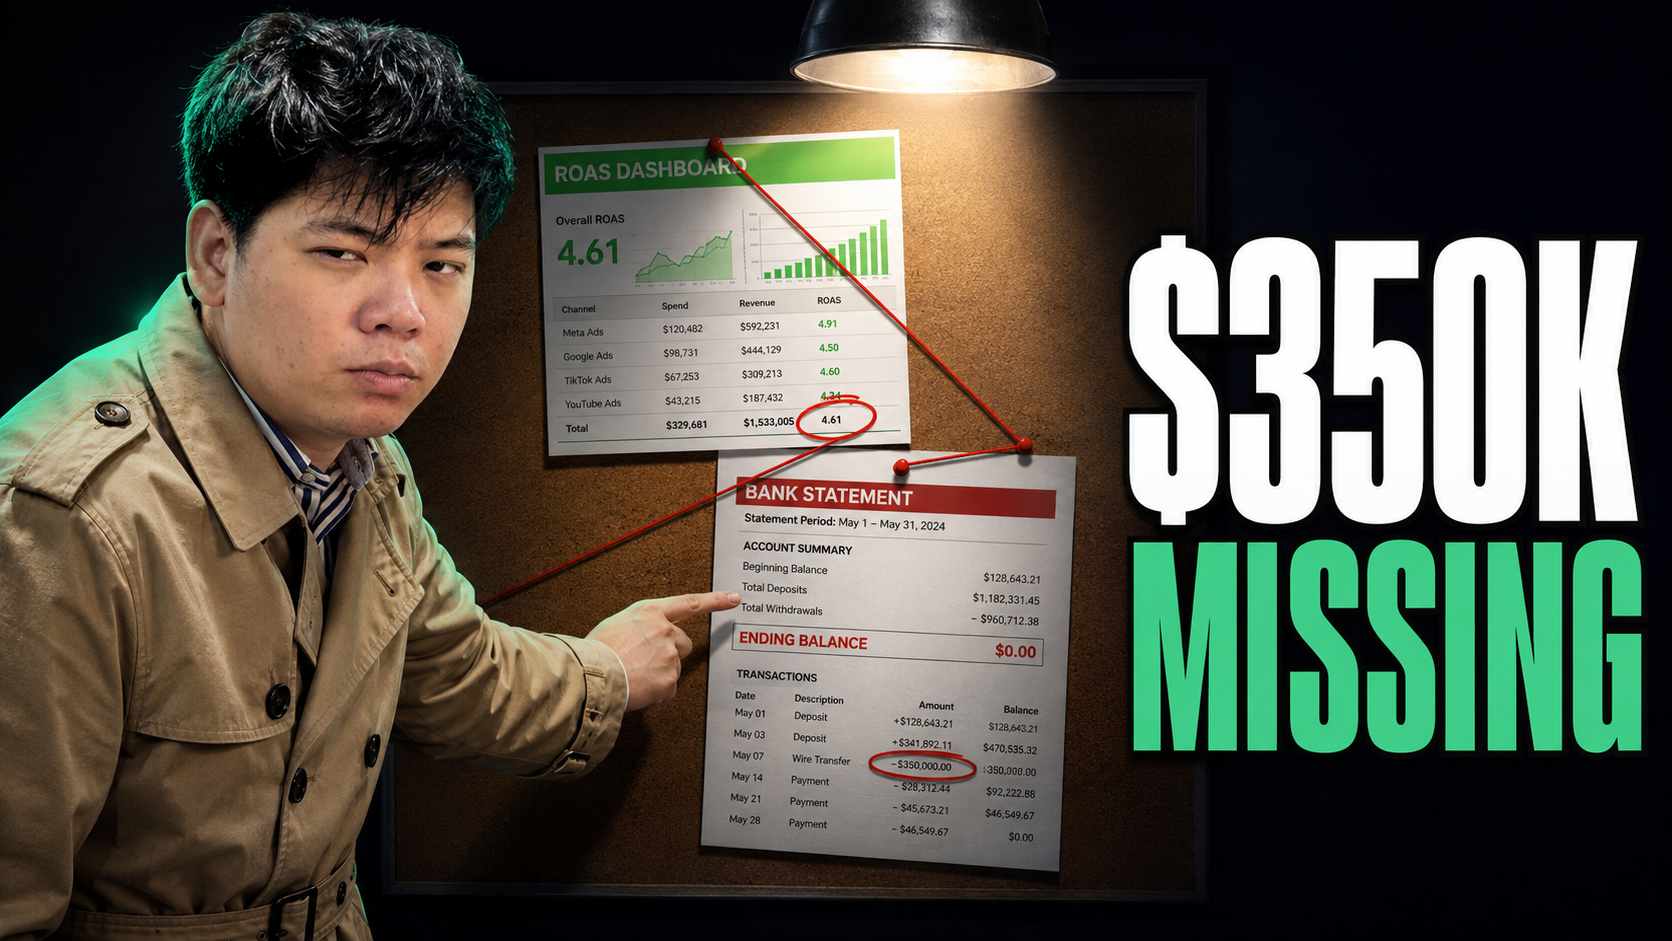
The first way: you open your attribution dashboard, the platform-reported revenue, the blended ROAS tile, the little green arrows. It says you cleared $380k in profit. You feel good. You plan the next hire off the back of it.
The second way: you open your bank balance and your actual profit-and-loss statement. It says $30k. Same month. Same business. A $350k difference between the story and the truth.
I wish that gap was rare. It isn't. And the brands that get hurt most aren't the sloppy ones - they're the ones growing fast enough that nobody's stopped to reconcile the two numbers in months.
So this is the audit I'd run before you make a single decision off a dashboard again. It's not glamorous. It's just the difference between a business you actually understand and one you're guessing at.
Why the two numbers drift apart in the first place
Here's the thing - your dashboard isn't lying to you on purpose. It's answering a different question than your accountant is.
Your ad platform and your attribution tool are built to tell you what they think your marketing drove. Your P&L is built to tell you what was actually left after every dollar went out the door. Those are not the same question, and the gap between them only ever points one way: the dashboard reads high, the bank reads low.
I've seen a founder run the same numbers for seven straight months, fully convinced they were profiting a few hundred thousand a month, then get on a call with their bookkeeper and find out the real figure was a tenth of that. Seven months. The tell was sitting in plain sight the whole time - the bank balance wasn't moving the way a few hundred grand a month should move it. Nobody looked.
So before we talk about fixing it, you need to know the five specific places the overstatement creeps in. Reconcile these and the mystery usually disappears.
1. Returns and refunds the dashboard already counted
Your dashboard books revenue at the moment of sale. Your bank books it after the customer keeps it.
Returns are the most common gap, and on some categories they're brutal - apparel can run a 20-30% return rate, and every one of those was already sitting in your "revenue" tile as a win. If you're reading top-line off the dashboard and your returns are landing two or three weeks later, you're celebrating money that's about to walk back out.
My take: pull your real return rate for the last 90 days and apply it to dashboard revenue before you call anything profit. A brand sitting at a reported $200k month with a genuine 25% return rate isn't a $200k month. It's closer to $150k, and your margin has to survive that haircut.
2. The fees nobody tiles up
Payment processing, transaction fees, the platform's cut, app subscriptions, chargebacks. Each one feels small. Stacked, they're rarely under a few percent of revenue, and they almost never appear on a marketing dashboard at all.
To put that in perspective: on a $100k revenue month, 3% in blended fees is $3,000 that exists on your bank statement and nowhere on your dashboard. Run that across a year and you've quietly mislaid a number big enough to matter.
These aren't hidden. They're just not where you're looking, because the tool you're looking at was never built to track them.
3. COGS timing that flatters the wrong month
This one catches good operators out, because it's not about whether you count cost of goods - it's about when.
You pay for inventory in one month. You sell it across the next three. If your dashboard is matching this month's revenue against last month's much smaller cost, this month looks fantastic and the month you actually paid the supplier looked like a disaster. Neither reading is true. The profit's real, it's just smeared across the calendar in a way that makes any single month untrustworthy.
What I'd do: never judge profitability on a single month off the dashboard. Look at a rolling quarter where the buying and the selling have had time to line up. One month in isolation is noise.
4. The ad spend that never made it onto the report
Most founders trust their blended ROAS because they assume the spend side is complete. It usually isn't.
The agency retainer. The creative production. The influencer you paid in product and cash. The new tool you trialled. The boosted post from a different login. None of that flows into the platform's spend figure, so your blended ROAS is calculated against a denominator that's too small - which makes the ROAS read higher than your real cost of customer acquisition.
Here's a quick gut-check. Total every dollar that left the business in service of getting a customer last month - not just what the ad platform reported. Divide your revenue by that fuller number. If the honest figure is meaningfully below the dashboard's, you've found part of your gap.
5. Attribution counting the same sale more than once
This is the big one, and it's the hardest to see.
When Meta claims a purchase and Google claims the same purchase and your email tool claims it too, your dashboards sum to more revenue than your store actually took. Each platform is graded on its own homework, and each one is incentivised to take credit. Add three platforms together and you can manufacture revenue that never existed.
The fix is boring and it works: your Shopify number is the truth. Total store revenue is the ceiling. If your platform-reported revenue across all channels adds up to more than what Shopify banked, the difference is double-counting, full stop. That's the number to trust, and everything else gets reconciled down to it.
How to actually run the reconciliation
You don't need a finance team for this. You need one afternoon and a willingness to look at the unflattering number.
- Anchor on two real figures. Total revenue from Shopify, and money actually received in the bank. These are your fixed points. Everything else gets measured against them.
- Walk the dashboard's profit down through the five gaps above. Strip out returns, strip out fees, apply real COGS over a rolling quarter, add the spend the platform missed, and collapse the double-counted revenue to the Shopify ceiling.
- Compare the result to your P&L. If they're within a few percent, your dashboard is trustworthy and you can keep making decisions off it. If there's a chasm, you now know roughly where it's hiding.
- Recheck your two real working numbers off the reconciled figure. Your true MER is total store revenue over total spend - all of it, not the platform's slice. Your true blended CPA is total spend over total purchases. Both are usually worse than the dashboard implied, and both are the ones worth running the business on.
That's the whole exercise. It's deliberately unsexy. The point isn't a prettier dashboard - it's knowing which number to trust when you're about to bet on it.
What the size of the gap is actually telling you
A small gap is fine. Every business has one. A few percent between dashboard and P&L is just the normal friction of returns and fees catching up.
A large gap is a warning, and it's worth reading honestly. A reported profit that's three or four times your real one means you're scaling spend off a number that doesn't exist - and the day the bank balance finally catches up with the dashboard, it tends to catch up all at once. That's the version that quietly kills otherwise healthy brands. Not a bad product. Not bad ads. A founder who trusted the wrong number for one quarter too long.
So I'd genuinely rather you find a painful gap now than a fatal one in six months.
If you've never lined your dashboard up against your P&L line by line, that's exactly the kind of thing a Signal/Noise Audit is built to surface - we reconcile MER and blended CPA back to the real numbers for every client before we touch a budget, because there's no point optimising spend against profit that was never there. Run it yourself first if you'd rather. Either way, get the two numbers in the same room.
Where's your gap right now, and which number have you been making decisions off - the one on the screen, or the one in the bank?


Recent Insights®


.webp)
Powered by © Pigeon Digital 2026. All rights reserved.
We acknowledge the Traditional Owners of the land on which we work, the Wurundjeri Woi Wurrung Cultural Heritage Aboriginal Corporation people of the Kulin Nation, and pay our respects to Elders past and present. We recognise their continuing connection to Country, culture and community.